- 0
- 15.1K
- 0 likes
Advanced Basketball Analytics Formulas to Help You Win
There has been a lot of controversy around basketball analytics and as a coach, if you can adjust your team’s play based on basketball statistics, could make a difference in the outcome of your team’s performance.
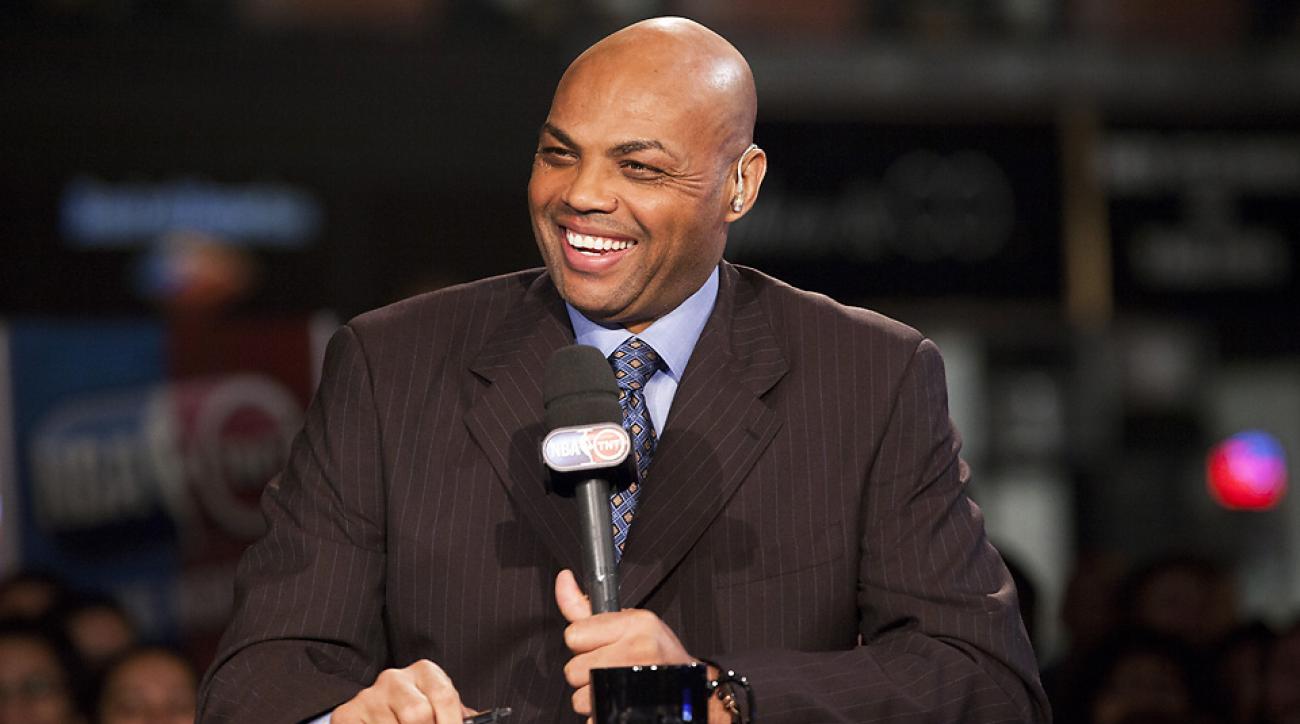
It is interesting when the same people, such as; Charles Barkley declare basketball analytics crap when he uses the same data to make the necessary statements to back up his claims about the game.
Charles Barkley statement about Basketball Analytics:
“Analytics don’t work at all. It’s just some crap that people who were really smart made up to try to get in the game because they had no talent. Because they had no talent to be able to play, so smart guys wanted to fit in, so they made up a term called analytics. Analytics don’t work.
What analytics did the Miami Heat have? What analytics did the Chicago Bulls have? What analytics do the Spurs have? They have the best players, coaching staffs who make players better.

Like I say, the Rockets sucked for a long time. So, they went out and paid James Harden a lot of money. Then they went out and got Dwight Howard, they got better. They had Chandler Parsons, this year they got Ariza. The NBA is about talent.
All these guys who run these organizations who talk about analytics, they have one thing in common: They’re a bunch of guys who ain’t never played the game, they never got the girls in high school, and they just want to get in the game.”
Mark Cuban’s statement about Basketball Analytics:
“We started using advanced plus/minus to help us, and it started to help us quite a bit,” Cuban said in the interview. “It eventually helped us come back from a 2-0 deficit in the playoffs against Houston, based on what the numbers said. Putting JJ (Barea) in the mix in the championship run had a lot to do with analytics.
It really didn’t matter what the analytics were because we knew that we could make him better. You use analytics as a way to identify guys, and you use the eye test to confirm or not whether they can be an asset to your team, and vice versa, you use the eye test to say this guy looks good, but then you see in the numbers if you are missing anything. So they have to go hand in hand.
Now the old school guys have sold their teams to hedge fund guys, data-driven guys, guys who understand numbers, understand investing, and understand trying to hire the best people possible in order to win. These guys are much smarter in that area, and because of that, they bring in GMs who are data driven, as well.”

Both Cuban and Barkley have interesting points-of-view! Nowadays, you can’t really have an intelligent conversation about basketball without relevant statics to back up your opinions.
Even though there are a ton of opinions about basketball analytics and if it is beneficial to the game, let us discuss several advanced basketball stats and their obvious importance to the game of basketball.
Player Efficiency Rating
PER is one of the most commonly used basketball metrics. This metric measures a player’s productivity per minute.
It makes additions of all positive contributions made by a player to his team and subtracts negative onsets in a statistical point value system.
PER also makes adjustments for the pace and playing time to make easier comparisons between players.
PER takes into account the following stats; field goals, free throws, 3-pointers, assists, rebounds, blocks and steals, and negative stats, such as missed shots, turnovers, and personal fouls.
The major drawback here is that there are no reliable defensive stats to get into the basketball efficiency formula. PER largely measures offensive performance.
In my opinion, blocks and steals aren’t always linked to good defense. Therefore, in this metric coaches are at a disadvantage.
Ultimately, PER can paint a distorted picture of a player’s value. You do not want to know how to calculate this efficiency rating as it is a very complex basketball formula.
Here are the TOP 10 PER NBA Career Leaders:
*As of Feb. 26th (Stats Courtesy of Basketball-Reference)
Win Shares
This is used by coaches to estimate the contribution of each player to the team’s win total.
It is used to credit offensive win shares achieved by calculating the marginal points of the player.
They are credited by computing the marginal defense of the player from the defensive rating and is then divided by the marginal points per win.
It means that the defensive and offensive win shares are added together to get the total shares.
Win shares measure the value of the player based on the wins achieved. It is important to split them into defensive and offensive win shares because the move values both halves equally.
Unlike PER, win shares value overall playing time. These analytics in basketball are easy to interpret.
Offensive Efficiency/Offensive Rating and Defensive Efficiency/Defensive Rating
These two are on a team level calculated as points allowed per 100 possessions and points scored. The formula used here is as follows:
Equation
Possessions = .96 * (FGA – ORB + (.44 * FTA)) + TO
.44 means that when a player scores and is fouled, they end up shooting a free throw that is not counted as a possession.
Totals are fully influenced by variables such as pace or the possessions acquired in a game.
Depending on your coaching philosophies, these can differ. Defensive and offensive are adjusted for pace. Team ratings are calculated as:
Offensive Rating = Points Scored x 100 / by Possessions.
Defensive Rating = Points Allowed x 100 / by Possessions.
Points Per Possession
Points-per-possession analytics in basketball has become very common in basketball analysis. It breaks points per possession for each individual and team depending on the style of play.
The numbers are very specific although they are powerful tools when drilling down a team’s or a player’s scoring tendencies.
This stat makes it easy to support a claim for the best player in a league.
Equation
Points per Possession = Points / Possessions
Points per 100 Possessions = (Points scored * 100) / Possessions
POSSt = FGAt + 0.44 × FTAt – OREBt + TO
This basketball analytics formula is a more accurate measurement of the total number of possessions.
The .44 helps with understanding total possessions. This percentage helps to measure how many possessions occurred during the total number of FT attempts.
True Shooting Percentage
It is common knowledge that the two most efficient ways of scoring in basketball are free throws and three-pointers.
TS% takes the two into account using the overall scores and weighting free throw attempts. TS% can also be applied to teams.
When calculating for teams, the coach has to focus on the separate free throws from the field goals.
The focus is always on the goal percentage that measures the shooting efficiency of a particular team from the field.
Equation
It is calculated by: 
Where:
- FGA = Field Goal Attempts
- FTA = Free Throw Attempts
- PS = Points Scored
It is obvious that Chef Curry has one of the highest True Shooting Percentage in the NBA today! You don’t need a basketball analytics formula to figure that out.
To improve your true shooting percentage like Steph Curry, check out this Shooting Workout!
Free Throw Rate
This one focuses on the free throw attempts divided by the field goal attempts. In fact, free throw rate is a major factor for basketball success.
It is an indicator of offensive efficiency. The most efficient way to score are free throws, lay-ups, and three-pointers.
This metric is calculated for the team and the players and is an essential measure for basketball analytics.
Rebound Rate
As opposed to rebounding numbers, rebounding rate gives the percentage calculation of available rebounds that a player or a team grabs.
It adjusts for variables such as pace for teams and minutes played for players. Rebound rate shows the difference in percentage between the rebounds obtained by one team compared to the opponents.
Rebound Rate is calculated by the percentage of missed shots that a player rebounds.
Equation
Rebound Rate = (100 x (Rebounds x Team Minutes)) divided by [Player Minutes x (Team Rebounds + Opponent Rebounds)]
Shot Locations
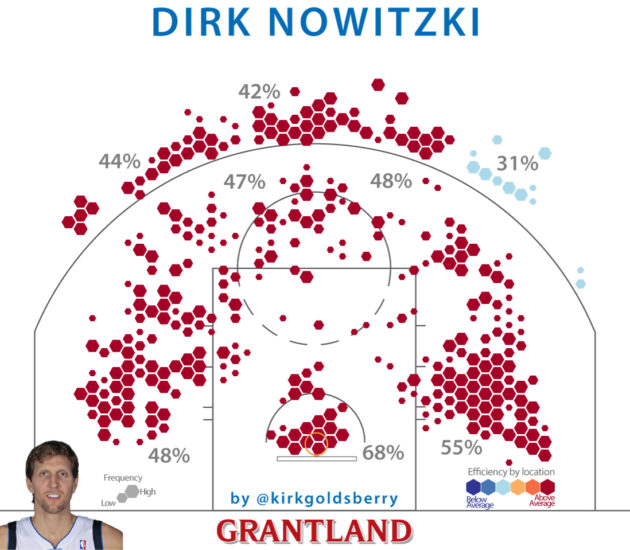
There are very strong tools available for breaking down the shooting stats to classified shot locations.
The shot location data is split by zone or range, and this allows you to see how teams or players shot from specific areas.
The basketball analytic provides the perfect solution for the trainer or coach to enhance his or her training program as the team is being prepared for a defiant win.
Understanding shot locations can help a coach determine how to set up plays for certain players and the entire team. These are the shots that the team or player naturally make better plays at on the court!

Assist to TURNOVER RATIO
AST is a great metric to evaluate a player’s ball control. This is evaluated on a theory that if a player has more assists and fewer turnovers, they have better ball control.
One thing to consider with the assist to turnover ratio is that a player who can score a lot of points may have a low number of assists. Points are not factored in the AST metric.
However, comparing the AST amongst players, on a player such as the point guard may focus more on assists, therefore, could have a lower AST ratio.
Equation
Example
Assist to Turnover Ratio = 10 / 3
Assist to Turnover Ratio = 3.33
Conclusion
Some of these basketball metrics are advanced and have formulas that don’t make sense to the general public.
As coaches, we definitely have to understand some of the basic ones to help our team perform better on the court, such as; turnovers per game, free throw percentage, rebounds per game, and etc.
I don’t necessarily agree with Charles Barkley that basketball analytics is crap. I do think they hold some weight for how you can help your team or player adjust their behaviors on the court to help improve their chances of winning!
Like all sports statistics, they are great indicators but do not always tell the entire story of a player’s or team’s ability.
As a coach, do you use basketball analytics to coach your team?

TAG

Charlotte AAU Basketball

Stephen Curry Pete Maravich Infographic
RELATED POSTS
Copyright © 2013. Inspirational Basketball. Marketing & Website Design by Organic Clicks, LLC


LEAVE A COMMENT